As part of my Economics of Discrimination course this semester, I calculated the Gini coefficient for Madhya Pradesh’s rural areas, using household consumption data. This post details the steps I followed, along with key snippets of the code.
The Gini coefficient is a measure of inequality, with values closer to 0 indicating equality and those closer to 1 indicating inequality. For this analysis, I worked with household survey data and district-level shapefiles to visualize the results.
Step 1: Preparing the Data
The raw data was in multiple levels, so the first task was to aggregate various types of expenditures (food, consumables, durables) for each household.
Food Expenditure
I calculated monthly food expenditure by summing up both weekly and monthly data:
// Food (Monthly)
keep if questionnaire_num == "F"
keep if inlist(item_code, 129, 139, 159, 179)
collapse (sum) value, by(hhid)
rename value food_monthly

// Food (Weekly)
keep if questionnaire_num == "F"
keep if inlist(item_code, 169, 219, 239, 249, 199, 189, 269, 279, 289, 299)
collapse (sum) value, by(hhid)
replace value = value * (30/7)
rename value food_weekly
The two were merged, and the total food expenditure was computed.
Consumables and Durables Expenditure Similarly, consumables were aggregated across monthly, weekly, and annual intervals, while durable goods expenditure was annualized:
// Total Consumables Expenditure
merge 1:1 hhid using `c2', force nogen
merge 1:1 hhid using `c3', force nogen
gen consum_exp = consum_monthly + consum_weekly + consum_annual

// Durables Expenditure
collapse (sum) value, by(hhid)
replace value = value * (30/365)
rename value durables_exp
Combining All Expenditure Types The datasets for food, consumables, and durables were merged to compute each household’s total expenditure:
replace durables_exp = 0 if mi(durables_exp)
replace food_exp = 0 if mi(food_exp)
replace consum_exp = 0 if mi(consum_exp)
gen total_exp = food_exp + consum_exp + durables_exp
Step 2: Adjusting for Household Size
Expenditure data was normalized by household size to calculate the Monthly Per Capita Expenditure (MPCE):
gen mpce = total_exp / hh_sizeF
Step 3: Filtering for Madhya Pradesh (Rural Sector)
The dataset was filtered to include only rural households in Madhya Pradesh:
keep if state == 23 & sector == 1
Step 4: Calculating the Gini Coefficient
Using the ineqdeco command, the Gini coefficient was calculated for each district:
ineqdeco mpce [w = weights], by(district)
The results were saved as gini_output.dta for further analysis.
Step 5: Visualizing the Results
To create a map of Gini coefficients across districts, I used shapefiles for Madhya Pradesh. After merging the Gini data with the shapefile:
// Merge Gini data with shapefile
merge 1:1 district using "./kdb.dta"
drop if _merge != 3
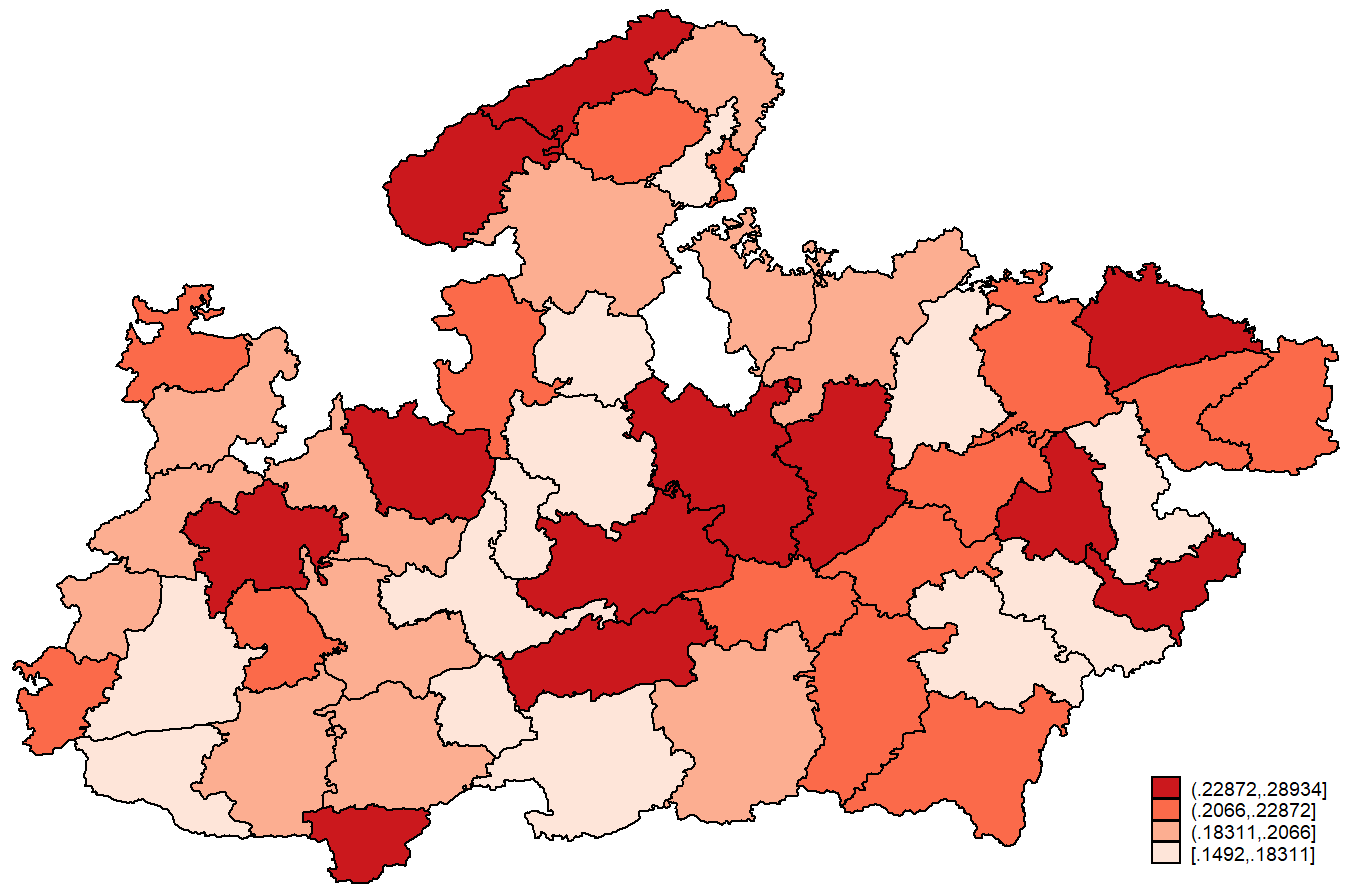
// Generate Map
spmap gini using kcoord, id(district) fcolor(Reds)
Below is the generated map image:
Conclusion
This exercise provided valuable insights into income inequality across Madhya Pradesh’s rural districts. The Gini coefficient offers a powerful tool to understand disparities, guiding policy decisions aimed at addressing economic inequality.
Feel free to reach out for the code or further clarification!
>> Home